Generating a triangle wave in code
Now for something between maths and programming.
Recently, for Advent of Code 2017, on day 13, I had to simulate a periodic triangular function (AKA triangle wave) in Java. Since I had trouble finding an online resource detailing the thought process from a mathematical function to code, I wrote mine. It is also partly documented in my solution.
Constraints
All I could tell from the problem was that I needed to generate a triangular time series T that would start from T(0)=0, increase linearly to a maximum image T(D)=D-1, then decrease linearly back to T(2*D)=0, and start over again.
Thought process
First of all, in order to draw plots for the series we will generate, we will apply D=3.
We start from the simplest function,
f1(t)=t, which will give us a linearly increasing function.
From there,
f2(t)=f1(t)%((D-1)*2)will give us a sawtooth wave, i.e a function that increases from 0 to (D-1)*1 and starts again from 0. The range and cycle size are now therefore correct.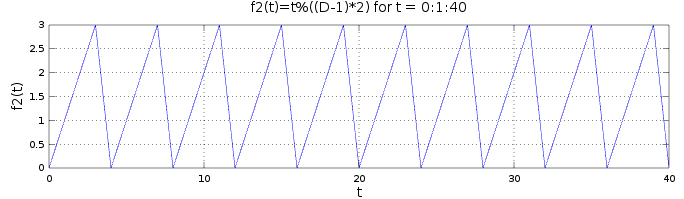
f3(t)=f2(t)-(D-1)offsets the sawtooth function by -(D-1) on the y-axis, making it increase from -(D-1) to D-1 and starting again from -(D-1). That way, half of each period is negative and half is positive.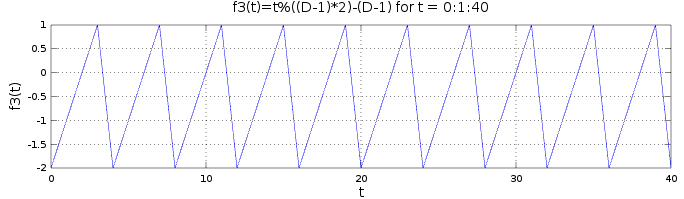
f4(t)=abs(f3(t))mirrors the negative half of each period around the x-axis, making the function decrease from D-1 to 0 and then increase back to D-1. The shape is now correct. Now the only issue is that the function starts at f4(0)=D-1 instead of f4(0)=0.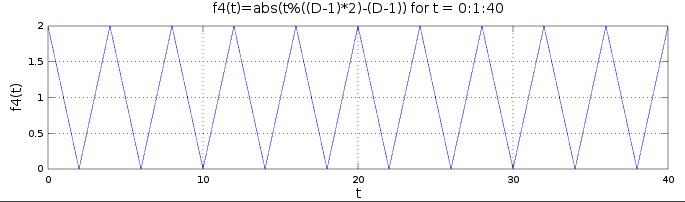
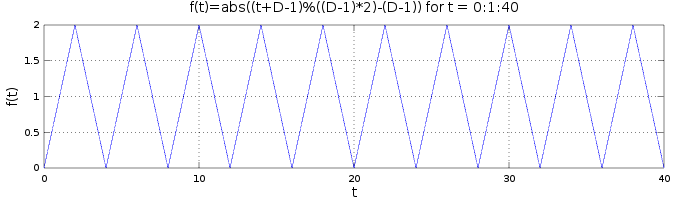
f5(t)=f4(t+D-1)offsetsf4by D-1, making it correctly increase from 0 to D-1, then decrease back to 1, and start again from 0.
We now put develop f5, resulting in the final function f(t)=abs((t+D-1)%((D-1)*2)-(D-1)), with the following plot:
So for example, I could write the following Java 8 code to print a transposed plot of the function:
1 | int D=3; |
Producing the following output:
|
||
|

|
||
|
And so on…
What we can learn from this
This may seem like a simple exercise, but I think this is a good illustration of how we can solve problems that seem theoretical. That is the essence of Computer-aided software engineering (CASE).
Note: The plots in this article were generated using GNU Octave. The final plot was created with the command `t=0:1:40; D=3; plot(t, abs(mod(t+D-1,(D-1)2)-(D-1)))`, along with some cosmetic improvements.*